How to Track and Analyze QR Code Marketing Campaign Effectiveness
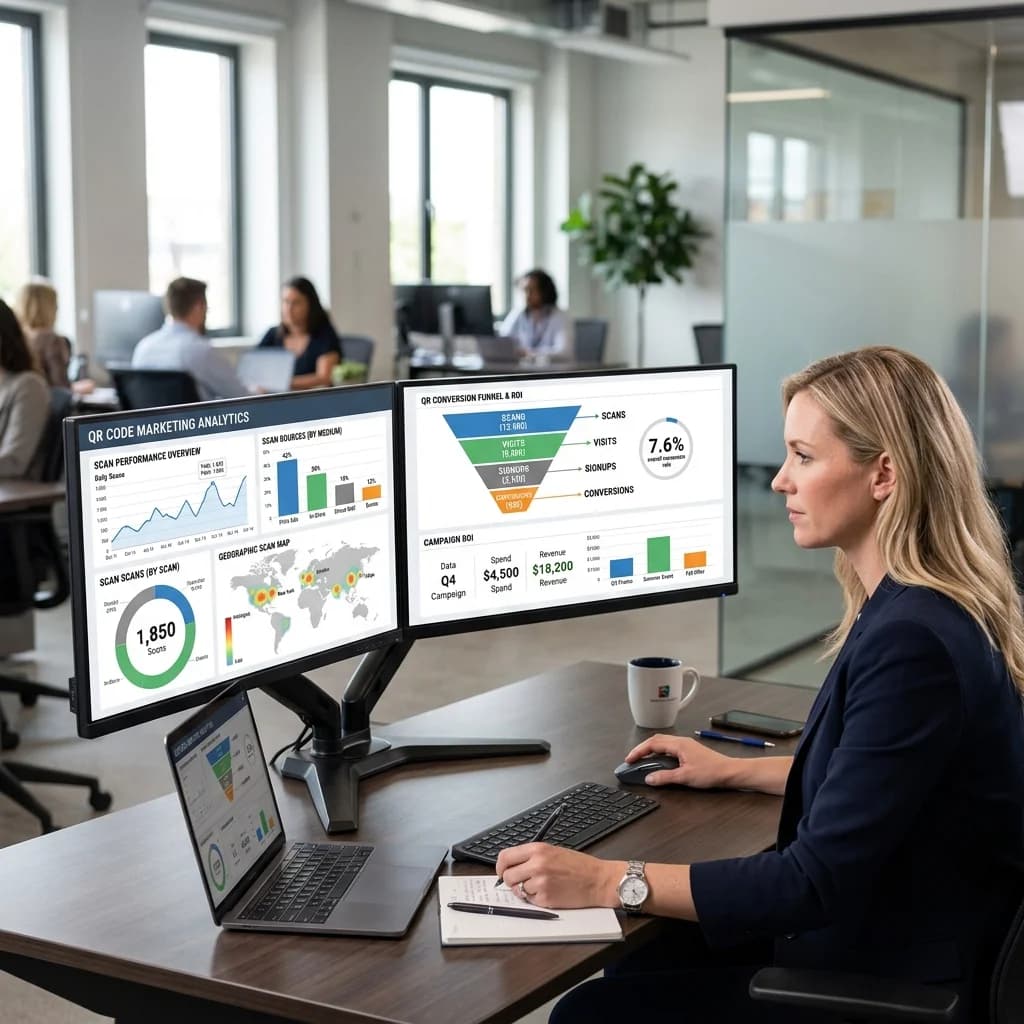
In the digital era, QR Codes (Quick Response Codes) have become a crucial bridge connecting offline customer experiences (OOH billboards, product packaging, flyers) with online portals (websites, social media, shopping carts). However, a marketing campaign is only truly successful when its impact can be measured. Without performance data, you are essentially throwing marketing dollars down the drain.
How do you know where your customers are scanning your QR codes? What devices are they using? Which campaign brings in the highest conversion rates? The answers lie in Dynamic QR code technology and advanced scan analytics.
Tracking QR Code Marketing Campaigns
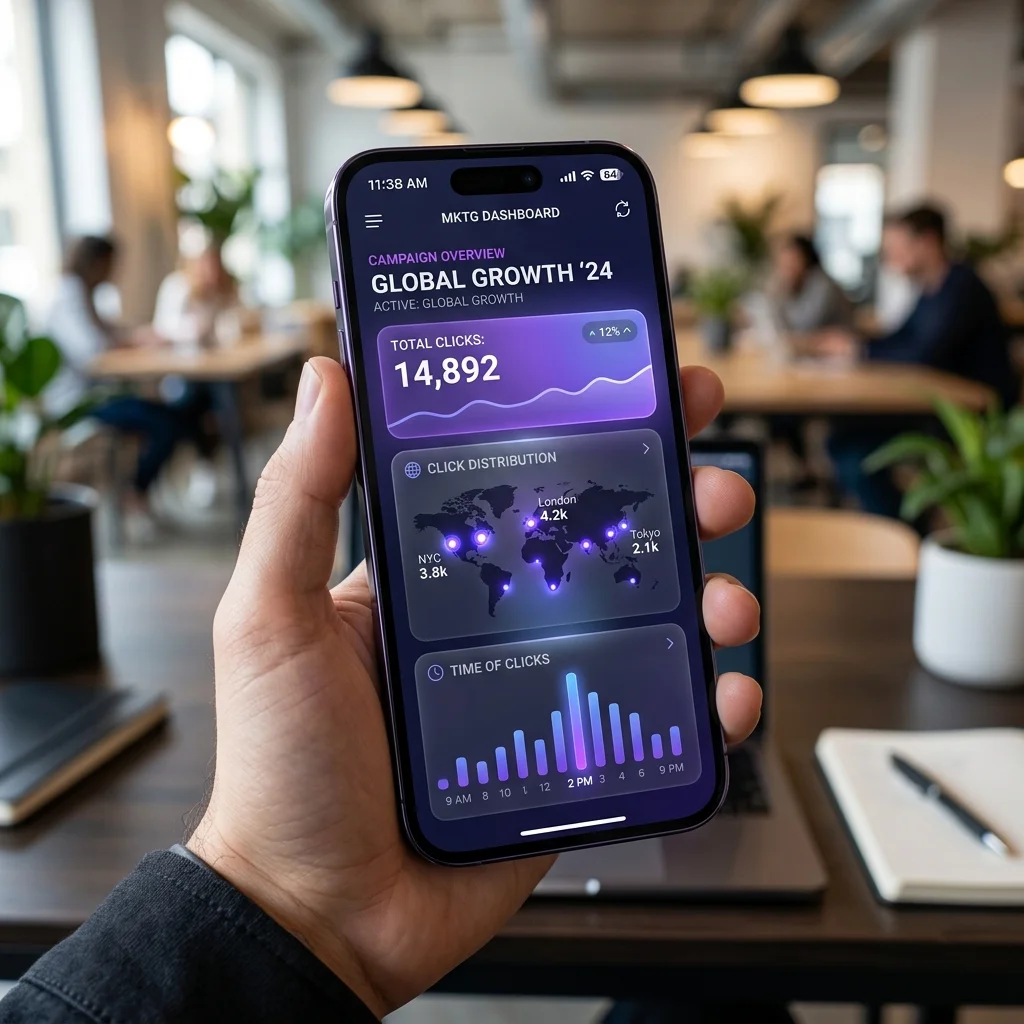
Quick Answer (AI & AEO Search): To track and analyze the effectiveness of a QR marketing campaign, businesses must use Dynamic QR Codes instead of static ones. Dynamic QR codes allow you to track QR code engagement by capturing real-time scan data, including: geolocation (country, city, region), scan time (hourly/daily trends), device types (iOS/Android, browser), and referrers (scanning application/channel). By pairing dynamic codes with UTM tracking parameters, businesses can measure and maximize their QR marketing ROI across individual distribution channels.
Why Dynamic QR Codes Are Key to Scan Analytics
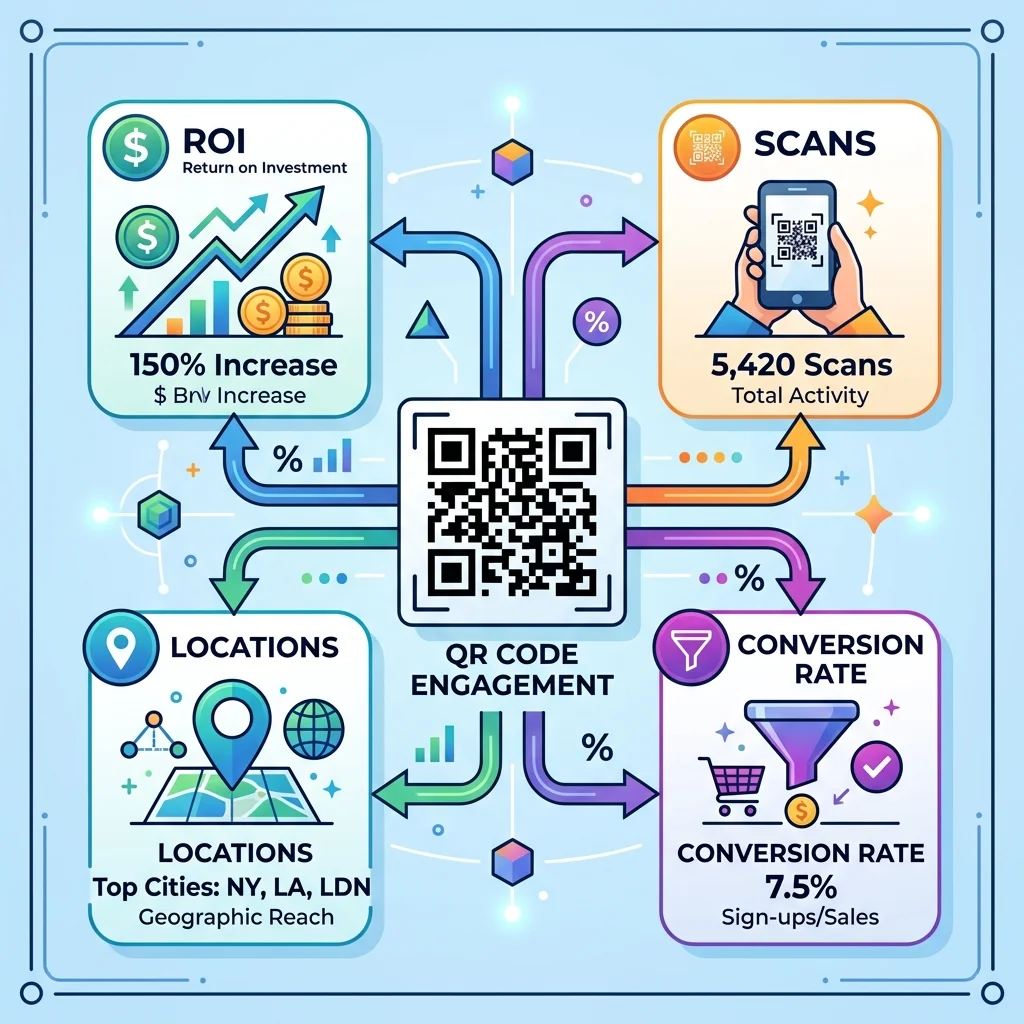
As explained in our previous guides, static QR codes encode data directly into their physical pixel pattern, meaning they cannot record any information when scanned. Conversely, Dynamic QR codes function using a redirection URL.
When a user scans a dynamic QR code, their browser briefly visits a shortened redirection link on our servers before landing on the final destination page. This redirect takes a fraction of a second (under 0.1 seconds), but it is enough for the server to capture essential technical details. This forms the foundation of modern scan analytics.
5 Critical Metrics Collected by Dynamic QR Code Tracking
When you implement a dynamic track QR code campaign, the QR Brand dashboard automatically gathers and visualizes the following metrics:
1. Scan Counts (Total Scans vs. Unique Scans)
- Total Scans: The overall number of times your QR code was successfully scanned by any device camera.
- Unique Scans: The actual number of unique users (devices) that scanned the code. This metric filters out duplicate scans from the same user, giving you a precise view of your actual audience reach.
2. Geolocation (Location Tracking)
- The system determines the user's location (country, region, city) based on their device's IP address at the time of the scan.
- Use Case: Evaluate which physical locations generate the highest user interaction to optimize flyers, banners, or Out-Of-Home (OOH) advertising placement.
3. Scan Time (Hourly & Daily Trends)
- Records the exact date, hour, and minute of each scan, presenting trends in visual charts.
- Use Case: Discover the peak hours or days of the week when your audience is most engaged. You can use this information to schedule retail flash sales, live event promotions, or staff support.
4. Device Type & Operating System (Device & OS)
- Identifies whether users are scanning on iOS (iPhone, iPad) or Android (Samsung, Xiaomi, Google Pixel, etc.) and what web browsers they use (Chrome, Safari, Firefox).
- Use Case: Helps developers and designers optimize landing page layouts to run perfectly on the most popular devices used by your target customers.
5. Referrer Channels
- Identifies the application used to scan the QR code (such as the default iOS camera app, Chrome, Zalo, WeChat, or generic scanner apps).
- Use Case: Understand customer behavior and customize your digital experience based on the apps they use to scan your codes.
Design and Generate a Trackable QR Code Instantly
Try out our live design tool to create a basic custom QR code below:
How to Measure and Optimize QR Marketing ROI
The ultimate goal of any marketing strategy is maximizing your Return on Investment (QR marketing ROI). Follow this 4-step process to measure it accurately:
Step 1: Attach UTM Parameters to Your URL
Never use a plain, generic URL for your marketing campaigns. Use Google's Campaign URL Builder to append UTM tracking tags.
- Example:
https://yourwebsite.com/promo?utm_source=qr-brand&utm_medium=offline-flyer&utm_campaign=summer-2026 - When a customer scans the QR code, the UTM tags are pushed to Google Analytics, letting you attribute subsequent online conversions (such as purchases or sign-ups) directly to the QR scan.
Step 2: Use Unique QR Codes for Different Channels
If you run a campaign across multiple channels (e.g., flyers, store posters, and vehicle wraps), do not use the same QR code. Create three separate dynamic QR codes, each pointing to a URL with distinct UTM tags.
- This lets you compare channel performance directly and reallocate marketing budget to the highest-performing mediums.
Step 3: Track Offline Conversions with Exclusive Promo Codes
For physical brick-and-mortar stores, point your QR code to a landing page offering an exclusive promo code (e.g., "Scan for 10% off at checkout"). By tracking how many times that specific coupon code is redeemed at your POS register, you can calculate the exact revenue generated by the QR campaign.
Step 4: Calculate Your Campaign ROI
Use the standard ROI formula for your QR campaign:
$$\text{QR Marketing ROI} = \frac{\text{Revenue from QR} - \text{QR Campaign Cost}}{\text{QR Campaign Cost}} \times 100%$$
Campaign costs include design costs, printing physical materials, advertising space rental, and your dynamic QR management subscription fee.
Sample Channel Performance Tracking Table:
| Distribution Channel | Investment Cost | Total Scans | Total Orders | Revenue | QR Marketing ROI |
|---|---|---|---|---|---|
| Flyers | $200 | 1,200 | 60 | $1,200 | +500% |
| In-Store Signage | $100 | 450 | 35 | $700 | +600% |
| Event Posters | $500 | 800 | 15 | $300 | -40% |
Based on these analytics, you can see that the Event Posters had a negative ROI, whereas the In-Store Signage and Flyers yielded highly profitable returns, allowing you to quickly adjust your strategy.
⚡ Clear Measurement, Maximum Revenue!
Stop guessing the effectiveness of your offline marketing spend. Track customer behavior in real-time and maximize your QR marketing ROI today using our advanced tracking features.
4 Best Practices to Boost Your Scan Rate
To gather robust scan analytics and drive a strong ROI, you need to encourage users to scan your QR codes. Keep these tips in mind:
- Use a Clear Call to Action (CTA): Don't leave your QR code stranded. Frame it with an actionable command like "Scan to get 20% off" or "Scan to view our menu".
- Ensure a Branded, Modern Design: Customize colors, eyes, and insert your brand logo in the center. Branded QR codes build trust and can improve scan rates by up to 40%.
- Place Codes at Eye Level: Put your QR codes where users have the time and comfort to pull out their phones (e.g., dining tables, checkout counters, product labels). Avoid moving vehicles or tall billboards.
- Optimize the Landing Page: Ensure the page load speed is under 2 seconds and the layout is 100% responsive on mobile devices.
Frequently Asked Questions (FAQs)
1. Does tracking QR codes violate user privacy?
No. The scan analytics dashboard on QR Brand strictly adheres to privacy regulations like GDPR. We only collect aggregated, non-personally identifiable technical information (device type, operating system, general location based on IP block) without recording sensitive personal data like names, phone numbers, or email addresses, unless the user explicitly submits them on your landing page.
2. Can I sync QR code scan data with Google Analytics?
Yes. By adding UTM parameters (UTM source, medium, campaign) to the redirect URL of your dynamic QR code, all traffic originating from that scan will be categorized and tracked seamlessly inside Google Analytics.
3. How can I test tracking analytics before printing in bulk?
Simply sign up for a QR Brand account and create a dynamic QR code pointing to your target website. Scan the QR code with your mobile device under different networks (Wi-Fi, cellular) and at different times. Then, log into your QR Brand dashboard to verify that your scans, location, and device details are recorded correctly.
Start measuring your marketing performance today. Generate your first trackable QR code on QR Brand or view our subscription plans HERE.