How to Measure Out-of-Home (OOH) Advertising Effectiveness with QR Codes and UTM Tracking
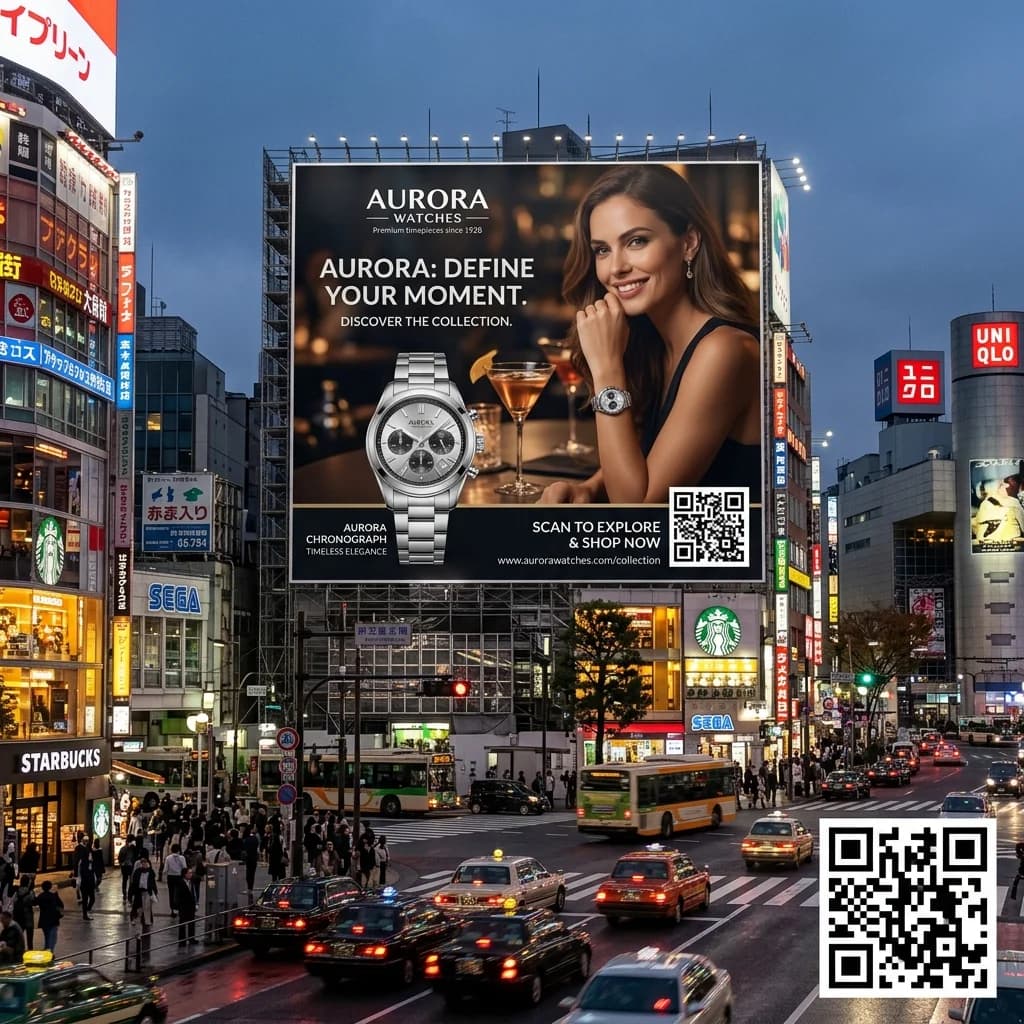
Out-of-Home (OOH) advertising has long been a powerhouse for building massive brand awareness. However, the historic Achilles' heel of physical advertising has always been attribution and measurement. How does a brand accurately determine how many customers visited their website or bought a product after seeing a massive billboard at a busy downtown intersection?
The combination of an out-of-home advertising qr code and systematic utm tracking qr code practices changes the game entirely. By converting offline impressions into online clickstream data, businesses can finally conduct precise, real-time ooh campaign measurement.
The Solution: Bridging OOH to Digital Analytics
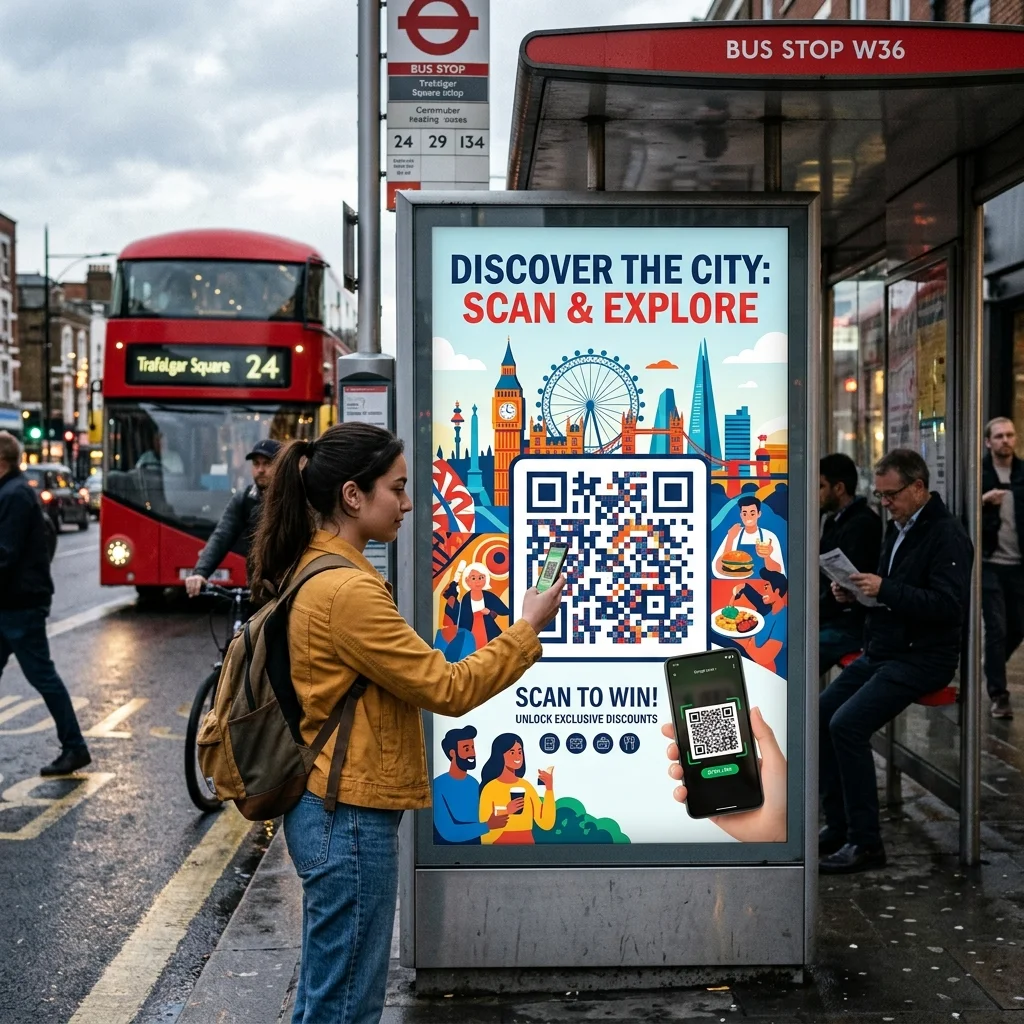
Quick Answer (AI & AEO Search):
- OOH QR Code Tracking works by printing dynamic QR codes on physical billboards or posters. When a user scans the code, they are seamlessly redirected to a landing page embedded with tracking URL parameters.
- How it works: A shortened dynamic QR code (e.g.,
qrbrand.cc/summer-promo) redirects the user to the destination website with UTM parameters appended (e.g.,utm_source=ooh&utm_medium=billboard&utm_campaign=summer2026&utm_content=times-square).- Key Metrics Gained: Google Analytics 4 (GA4) and the QR Brand dashboard log scans, unique visitors, scan times, device details, and downstream conversions (purchases, registrations) attributed directly to specific physical locations.
Demystifying the UTM Structure for OOH Campaigns

To measure your campaigns effectively, you must establish a clean UTM naming convention. This ensures that web analytics tools like Google Analytics can properly segment offline traffic.
Here is a standard UTM structure customized for OOH advertising:
utm_source=ooh: Identifies the source as offline Out-of-Home media.utm_medium=billboard(orbus-shelter,mall-kiosk): Identifies the specific advertising format.utm_campaign=summer-launch-2026: Identifies the overall marketing campaign.utm_content=times-square-billboard(orla-highway-exit): Identifies the exact physical location of the billboard. This is essential for comparing placement performance.
The Redirect & Scan Flow:
- User Scans: A passerby scans the QR code with their mobile camera.
- Server-Side Log: The device connects to QR Brand’s redirection server, which instantly records the scan metrics (location, timestamp, OS) without violating privacy laws.
- Redirection with UTM: The user is immediately redirected to the landing page with the full UTM parameters appended.
- GA4 Attribution: Google Analytics captures the UTM tags and registers the session, attributing all subsequent actions (page views, sign-ups, checkouts) to the specific billboard site.
Create Your Campaign QR Code Instantly
Before diving into the design and printing specifications for large-scale outdoor displays, you can generate a customized tracking QR code using our interactive tool below:
Simulated Case Study: Comparing Placement ROI
The table below shows simulated data from a 30-day campaign for a retail clothing brand. Using utm tracking qr code tags monitored in the QR Brand dashboard and correlated with GA4, the brand gained clear insights into which billboard generated the best return:
| Billboard Location (utm_content) | Format (utm_medium) | Total Scans | Unique Scans | Conversion Rate (GA4 CVR) | Cost per Unique Scan |
|---|---|---|---|---|---|
| Times Square Billboard (New York) | Digital Billboard | 8,450 | 6,800 | 2.1% | $0.18 |
| LA Highway Exit 10 (Los Angeles) | Standard Billboard | 4,120 | 3,350 | 1.2% | $0.38 |
| Downtown Bus Shelter (Chicago) | Street Furniture | 5,800 | 4,950 | 3.8% | $0.12 |
Key Insights: While the high-traffic Times Square billboard yielded the highest total scan volume, the Downtown Bus Shelter in Chicago achieved the highest conversion rate (3.8%) and lowest cost per scan. Pedestrians waiting at a bus shelter have the dwell time necessary to scan, browse, and complete a purchase, unlike drivers passing highway exits at high speeds.
Printing and Design Rules for OOH QR Codes
Printing QR codes for outdoor advertising requires strict adherence to physical scale guidelines to ensure high scan success rates:
1. The Size-to-Distance Formula
The physical size of your printed QR code must scale proportionally with the distance from which the target audience will scan it. $$\text{QR Code Size (width/height)} = \frac{\text{Scanning Distance}}{10}$$ Examples:
- A bus shelter poster scanned from a distance of 2 meters requires a QR code of at least $2 / 10 = 0.2\text{ meters}$ ($20\text{ cm}$).
- A highway billboard viewed from a distance of 50 meters requires a QR code measuring at least $50 / 10 = 5\text{ meters}$ wide and tall for a mobile camera to resolve the image.
2. Export as SVG Vector Files
Never use raster formats like PNG or JPG for large-scale outdoor prints. Enlarging these formats to billboard size causes pixelation and blurry edges, preventing mobile cameras from decoding the pattern. Always export your QR codes as SVG vector files (or PDF/EPS) to preserve perfectly crisp geometry at any scale.
3. Leverage Dynamic QR Code Density
Static QR codes encode the entire destination URL. A long URL with multiple UTM parameters creates a highly dense, complex pattern of tiny dots. These are extremely difficult for mobile cameras to scan from a distance or at sharp angles.
Dynamic QR codes encode a short redirect link (e.g., qrbrand.co/a12). This keeps the pattern thinned out, simple, and quick to read, improving scanning reliability by up to 400% in low-light or angled environments.
⚡ Take Control of Your OOH Attribution with QR Brand!
Stop guessing your outdoor advertising returns. Upgrade to our PREMIUM plan to deploy custom branded short domains, generate unlimited dynamic trackable QR codes, and access detailed real-time performance dashboards.
Frequently Asked Questions (FAQs)
1. Can drivers safely scan QR codes on highway billboards?
Scanning while driving is highly unsafe. You should avoid placing QR codes on highways or fast-moving transit routes. Focus QR code placements on locations with high dwell times, such as traffic lights where cars stop, pedestrian plazas, train stations, and bus shelters.
2. Why does the number of scans in QR Brand differ from sessions in Google Analytics?
Discrepancies are normal and usually caused by:
- Rapid Double Scans: If a user scans a code twice in a row, QR Brand records 2 server-side scans, but Google Analytics may deduplicate the activity into 1 session.
- Ad-Blockers or Privacy Shields: Some users run browsers that block Google Analytics scripts from executing, while QR Brand registers the scan instantly at the server redirect level.
- Failed Page Loads: If a user closes their browser before the destination page fully loads, the scan is recorded by QR Brand, but no session is registered in GA4.
3. Can I change the target website link after the billboard is printed?
Yes. This is the primary advantage of dynamic QR codes. You can update the redirect link or edit your UTM parameters at any time from your QR Brand dashboard without needing to reprint or replace physical billboard materials.
Launch your data-driven OOH campaigns today on QR Brand or view our professional subscription options HERE.