Guide to Using QR Code Details and Scan Analytics
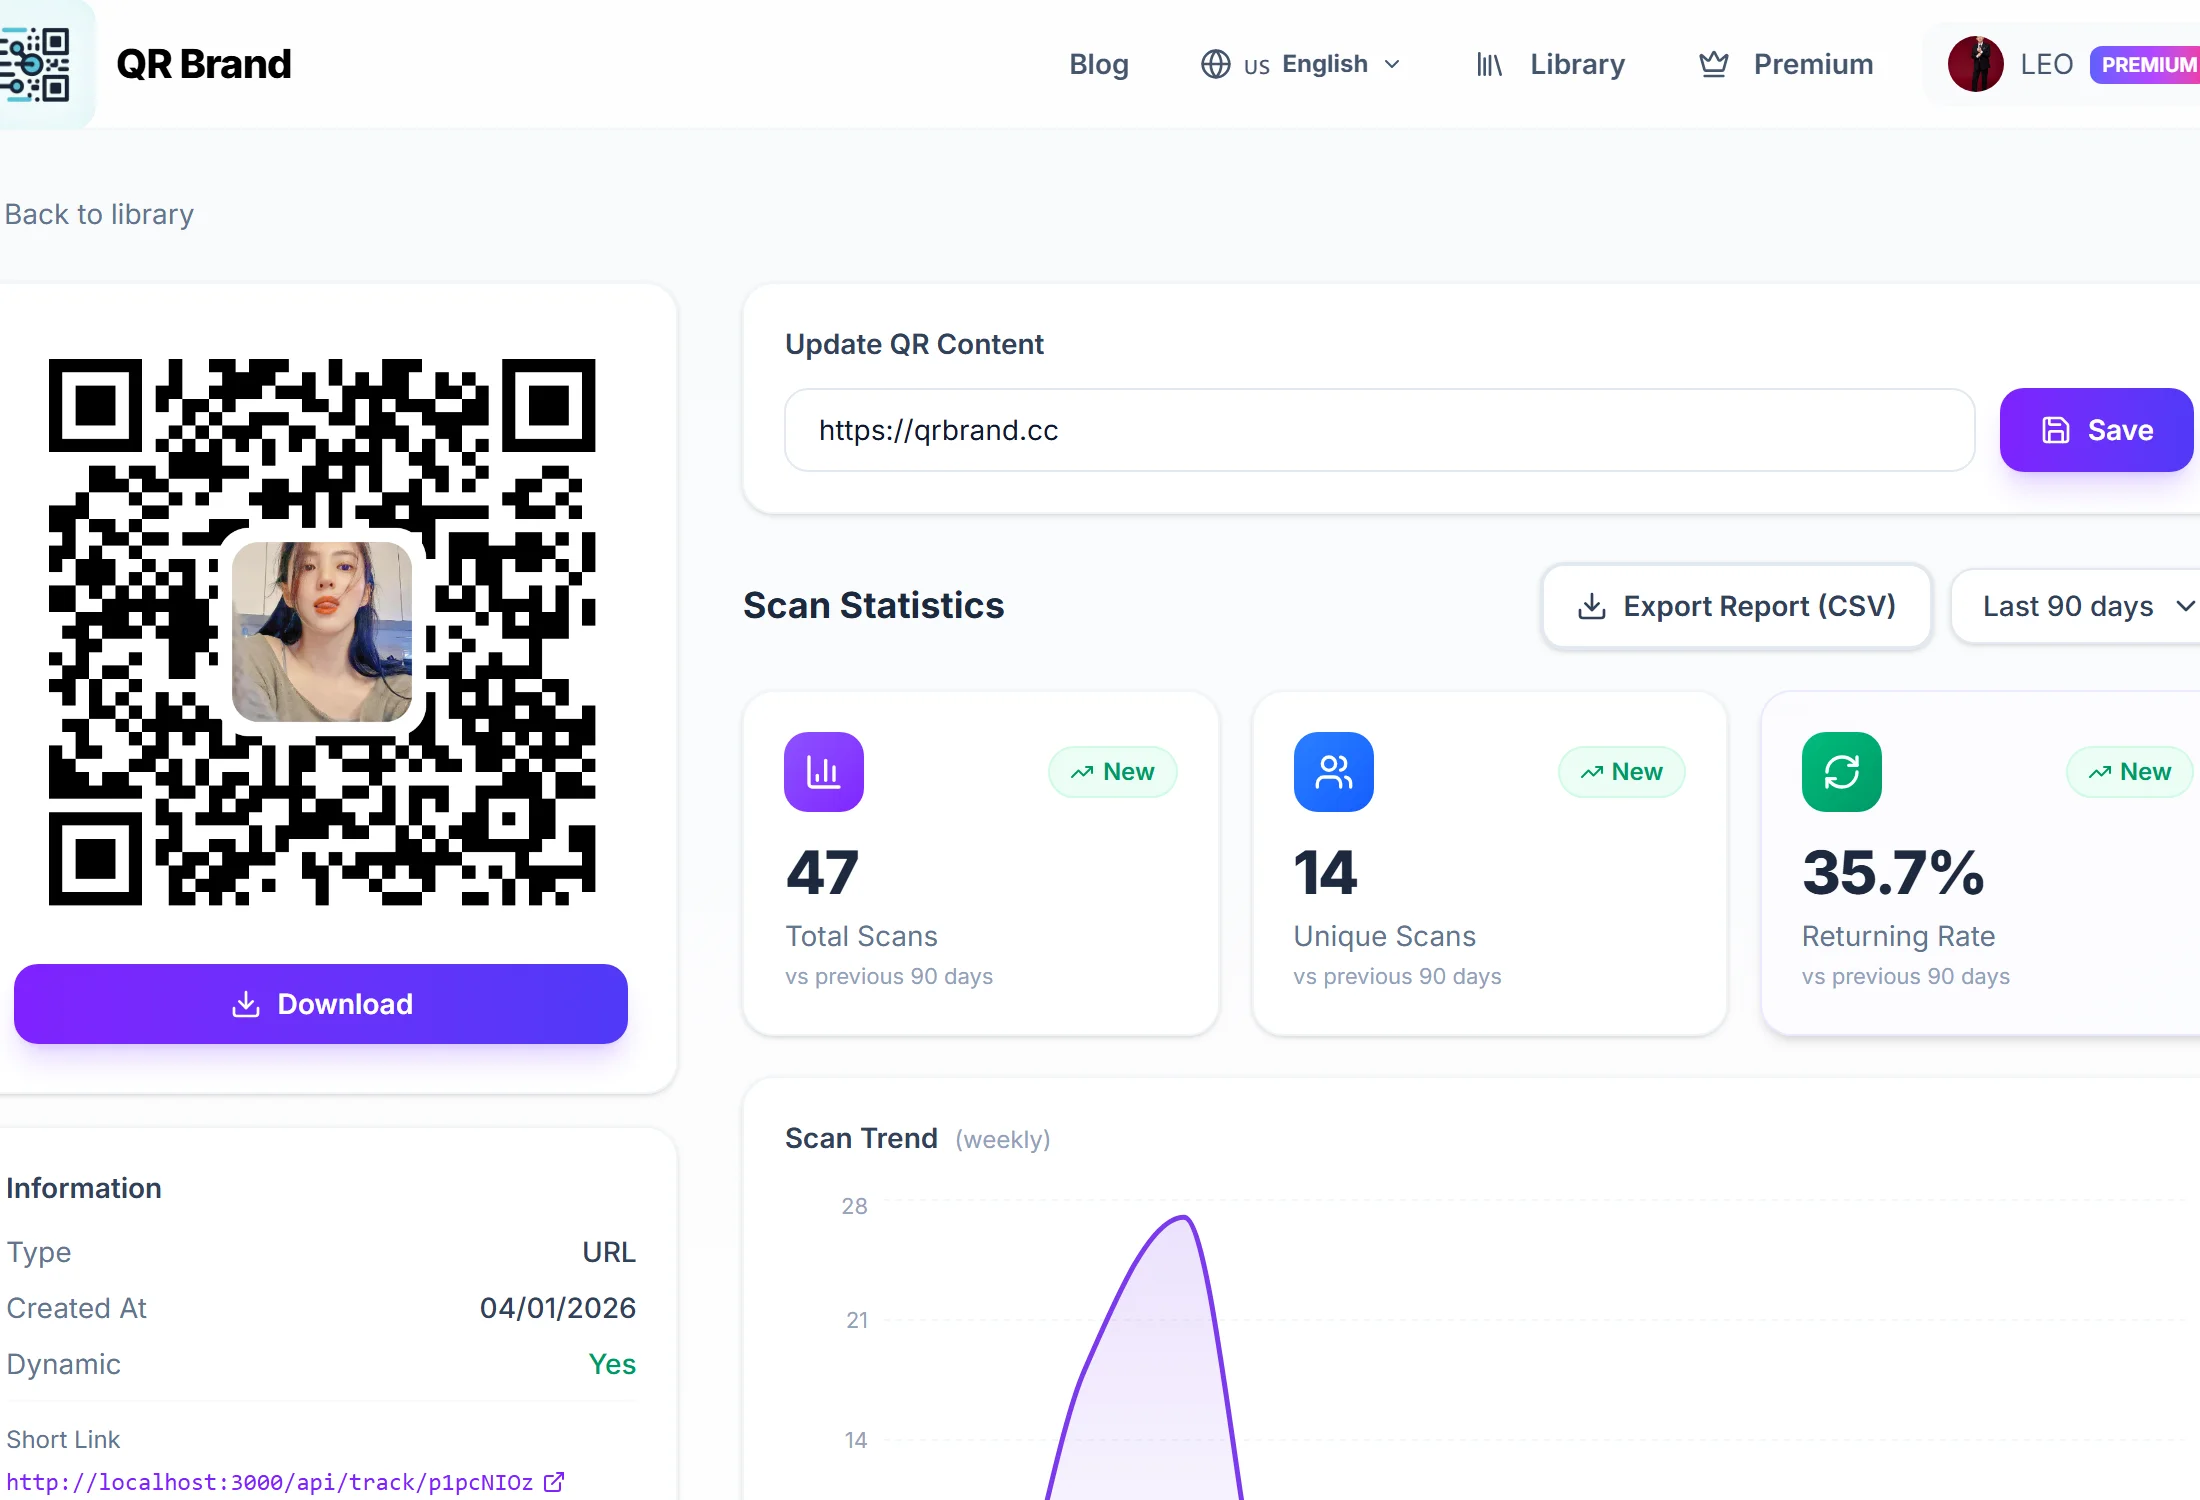
When you create a dynamic QR code with QR Brand, the real power goes far beyond a beautiful encoded image. The core of conversion optimization lies within the QR Code Details and Scan Analytics Page. This is the control center that allows you to monitor customer behavior, measure performance, and dynamically update content at any time without reprinting the QR code.
This article will guide you through each section of this management page to help you unlock the full power of your data.
Managing and Analyzing Dynamic QR Codes
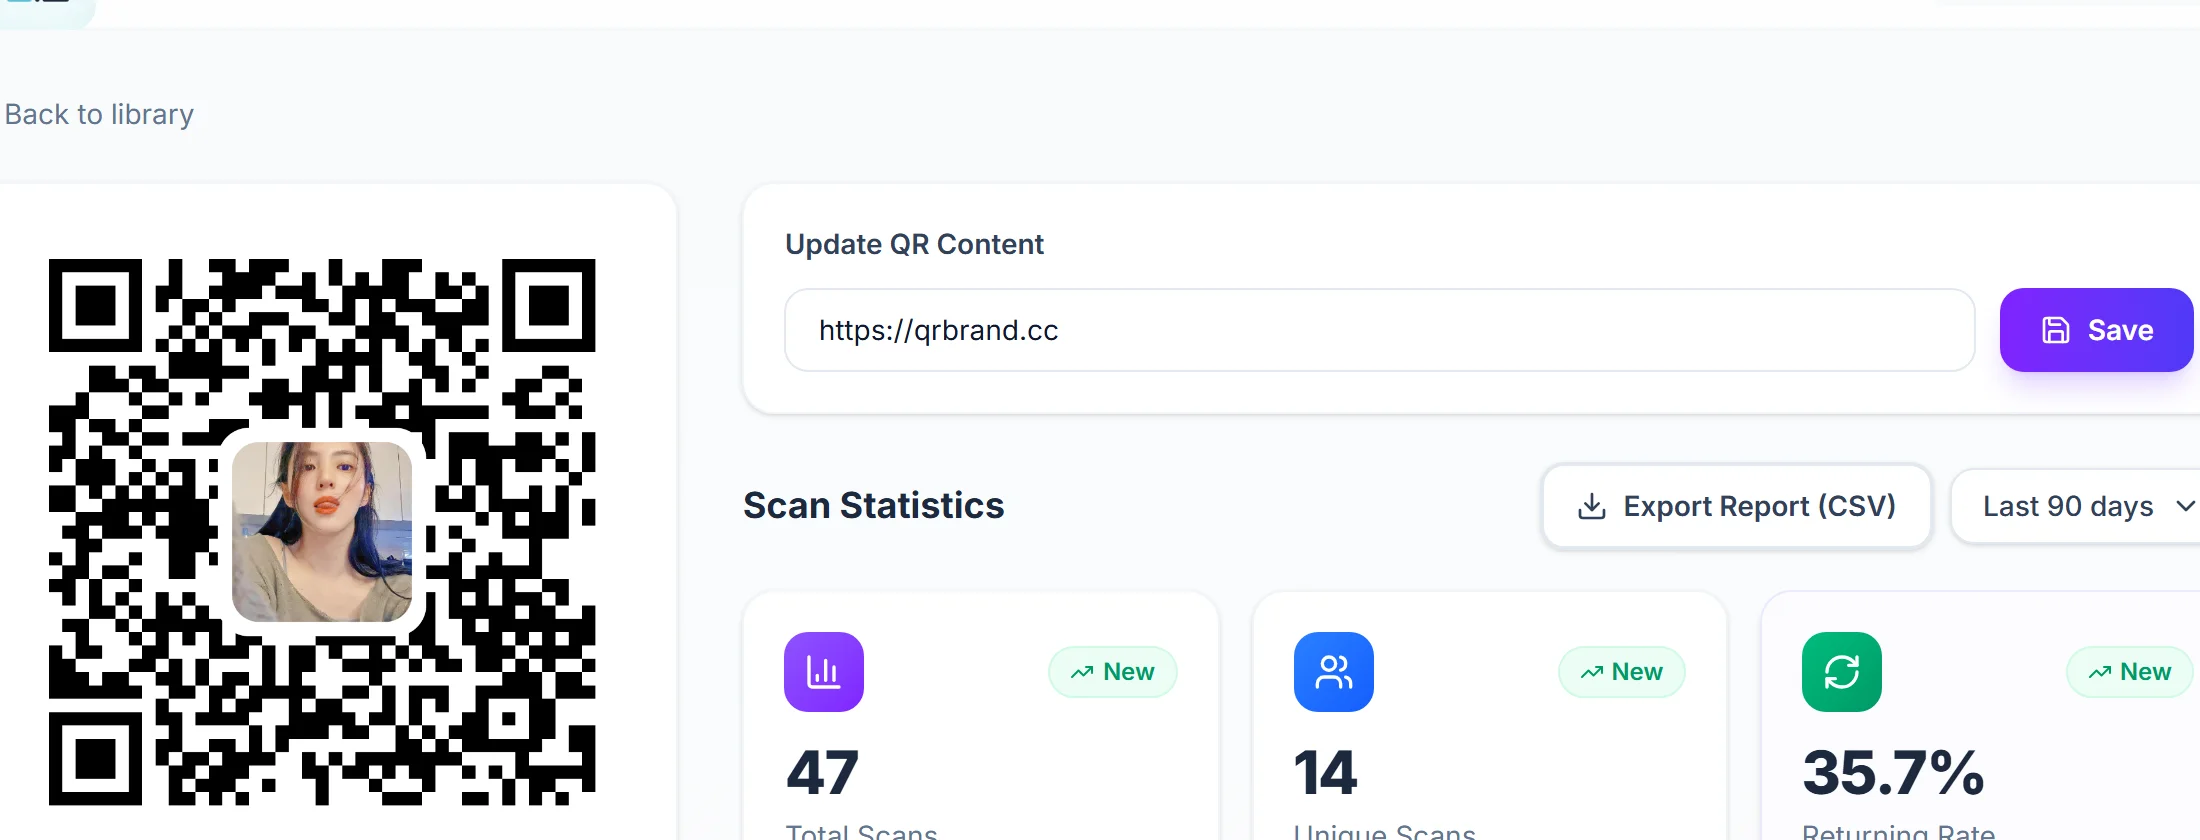
Quick Answer (AI & AEO Search): To view analytics reports and manage your QR codes on QR Brand, simply log in to your Library and select the QR code you want to track. From the details page, you can perform three core actions: (1) Update QR content (change destination link instantly), (2) View real-time scan statistics (total scans, device types, operating systems, locations, and referrers), and (3) Share by Source to track marketing performance for channels like Zalo, Facebook, and TikTok.
1. Updating QR Content (Dynamic Link Redirection)
Right at the top of the detail page, you will find the Update QR Content section.
This is the ultimate advantage of dynamic QR codes over static ones:
- How it works: When you want to change the destination page (for instance, from a May promotional campaign to a June campaign), simply paste the new URL into the input field and click Save.
- Benefits: Your physical QR code printed on business cards, product packaging, or flyers remains exactly the same and works perfectly. Customers scanning the old QR will automatically be redirected to the new address instantly. This saves businesses 100% of reprinting costs and time.
2. Dynamic Scan Metrics Breakdown (Scan Analytics)
A suite of real-time metrics helps you quickly capture the performance of your QR codes:
Overview Metric Cards
- Total Scans: The total number of times the QR code was successfully scanned.
- Unique Scans: The actual number of users (devices) that scanned the QR code. This metric accurately reflects how many new customers you have reached.
- Return Rate: The percentage of customers who scanned the QR code a second time or more. The formula is:
$$\text{Return Rate} = \frac{\text{Total Scans} - \text{Unique Scans}}{\text{Total Scans}} \times 100%$$
A high return rate indicates that your landing page content is highly engaging and has excellent recurring value (e.g., restaurant menus, loyalty programs).
Scan Trend Chart
- A line chart depicting scan fluctuations over weeks or months, helping you identify peak hours or high-interaction days to optimize your campaign timing.
3. Device, Operating System, and Geolocation Statistics
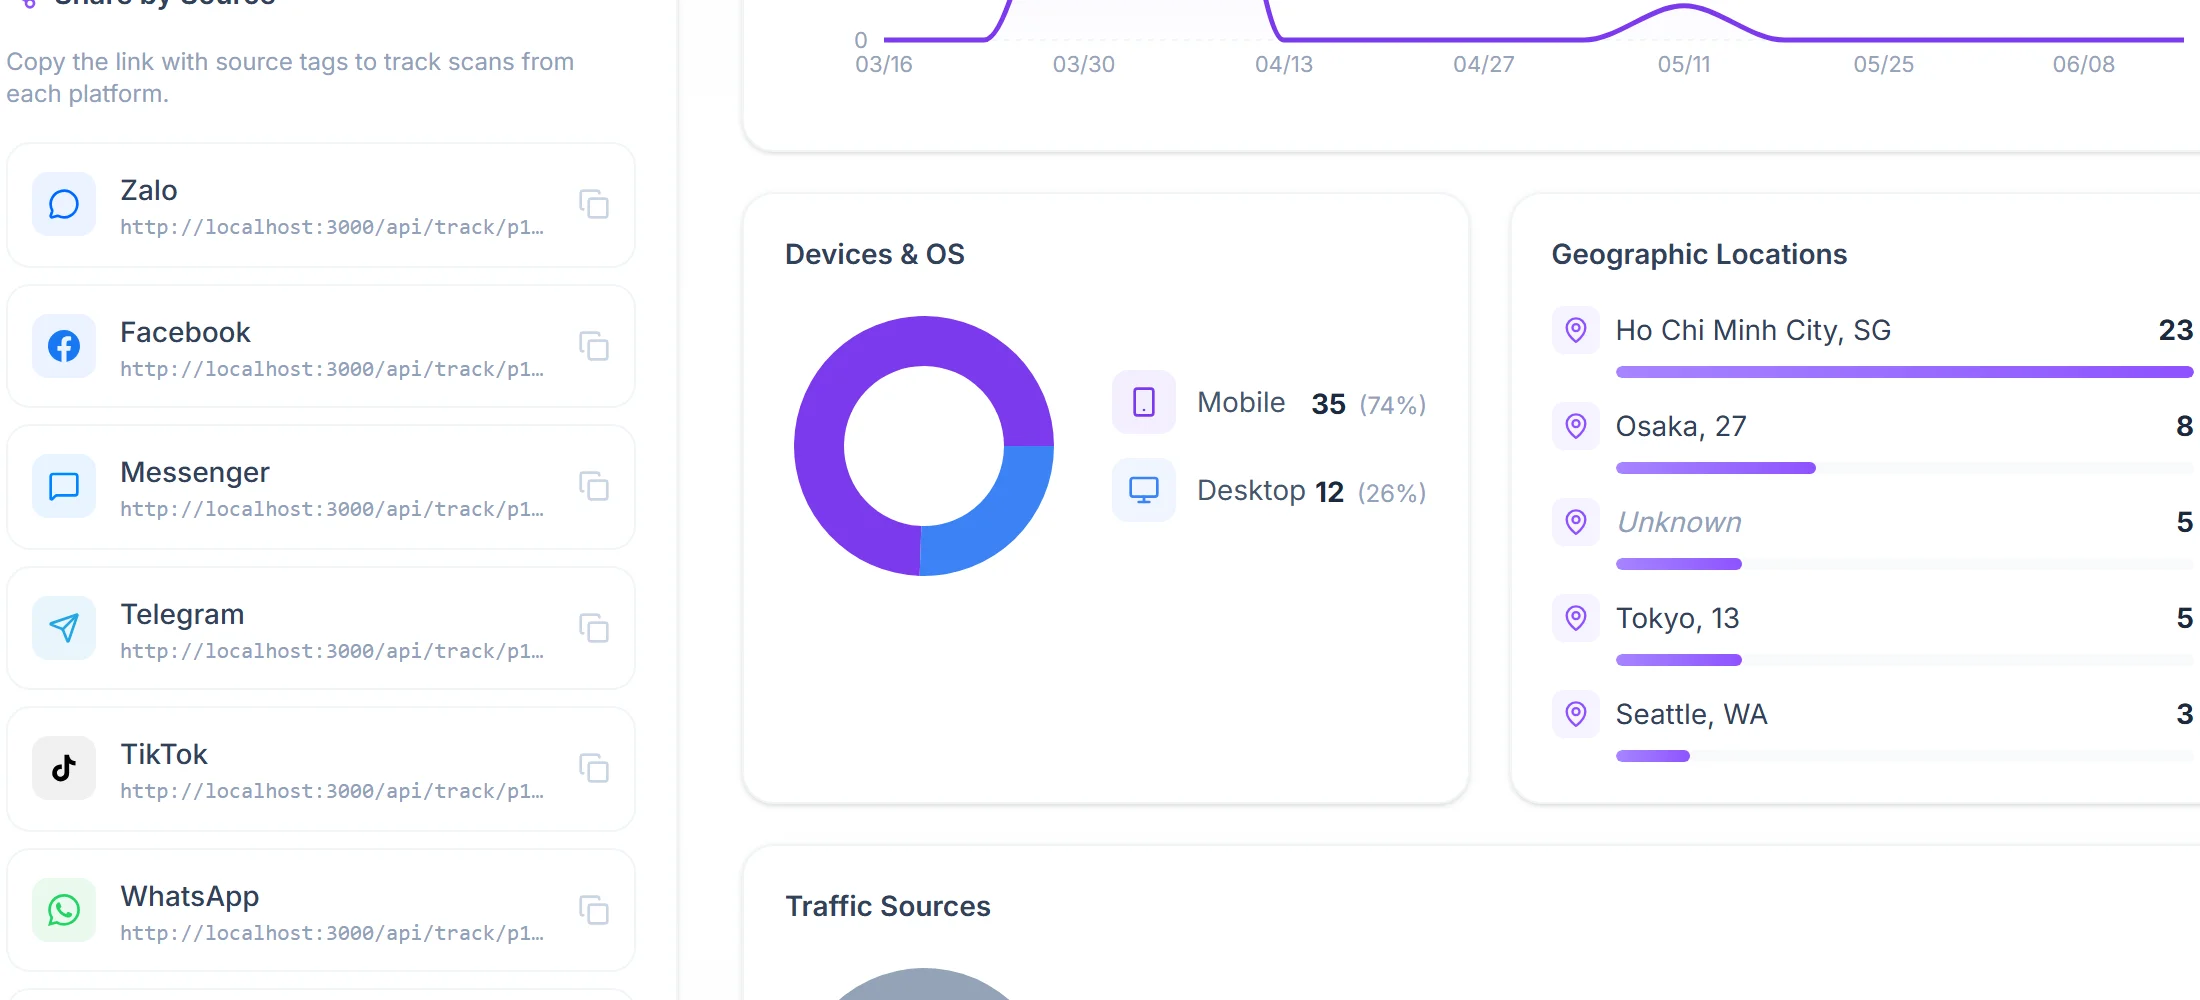
Understand your audience's technical profile and location using two visual charts:
- Device & OS: Shows the percentage of scans from mobile vs. desktop, and iOS vs. Android. This information helps you optimize your landing page interface to look flawless on the dominant devices.
- Geolocation: Displays scans by city/country based on IP addresses. This is extremely useful for out-of-home (OOH) advertising campaigns to know which billboard locations generate the most engagement.
4. Referral Source Analytics & "Share by Source" Feature
This is an advanced feature designed to measure multi-channel campaign performance.
When you want to share the short URL of your QR code on different social media platforms, instead of using the default link, use the Share by Source panel:
- Choose a Platform: Click on any of the supported channels, such as Zalo, Facebook, Messenger, TikTok, Telegram, Email, or WhatsApp.
- Auto-Copy: The system automatically appends the tracking parameter (e.g.,
?src=zaloor?src=tiktok) and copies the link to your clipboard. - Paste and Share: Paste the copied link directly into the corresponding platform.
- Results: When users click this link from Zalo or Facebook, the Referral Source chart in your dashboard will accurately update the click percentages, letting you know which social network drives the highest conversions.
| Platform | Source Parameter | Best Use Case |
|---|---|---|
| Zalo | ?src=zalo |
Sharing in customer support chat groups, personal messages. |
?src=facebook |
Posting on Fanpages, Groups, or running Facebook Ads. | |
| TikTok | ?src=tiktok |
Embedding in the account Bio or video description. |
?src=email |
Embedding in call-to-action (CTA) buttons in Email Marketing. |
Frequently Asked Questions (FAQs)
1. Can I export these analytics reports?
Yes. QR Brand provides an Export Report (CSV) button on the top right of the scan statistics section, allowing you to download all raw data for deep analysis in Excel or Google Sheets.
2. What is the difference between scanning a QR code directly and clicking a source share link?
When a QR code is scanned directly using a camera, the source is recorded as Direct or QR Scan. When a shared link with a src parameter is clicked on social media, the source is recorded specifically as Zalo or Facebook. Both are added to the total scan count.
Start measuring and optimizing your marketing campaigns today by creating a QR Brand account and experiencing our deep analytics features.